
The Algo Effect
Virality on social networks is not a random phenomenon, but the result of a complex interaction between algorithmic logic and social practices
This study introduces a quantitative framework for analyzing virality on social networks, distinguishing two key forces: linear growth (driven by initial organic exposure) and residual growth (nonlinear algorithmic amplification). Using S-curve logistic models and comparative simulations between high and low competition scenarios (peak vs off-peak), it shows that viral dynamics are deeply conditioned by the timing and intensity of the algorithmic effect. The integration of sociological perspectives and media studies enables a critical reading of algorithmic governance, its impact on digital identity construction, and dissemination strategies.
Key findings:
- In low-competition contexts, the residual component accounts for 97.83% of growth, versus 90.88% in peak time;
- The residual area is much wider off-peak, confirming a stronger algorithmic boost outside peak hours;
- The efficiency of hourly virality (share of residual growth per hour needed for algorithm activation) is significantly higher off-peak (about 69.9% per hour vs 21.6% at peak), thanks to faster algorithmic activation (1.4h vs 4.2h).
Algorithmic effect
Every content piece passes through algorithmic “filters” regulating its exposure and spread, generating feedback, conformity, and mass selection.
Central thesis: during periods of high competition, visibility initially follows a quasi-linear pattern; during low-competition hours, the algorithm anticipates and amplifies spread, enabling nonlinear virality.
Goal: to mathematically formalize and quantify the dual nature of viral growth (linear and residual), offering concrete support for publishing strategy and critical interpretation.
2. Theoretical Framework, Models & Media Theory
2.1 S-curve: Virality Theory
Viral dynamics are modeled using a logistic function (S-curve):
V(t) = L / (1 + e−k(t−t₀))
- L: maximum reach potential
- k: growth rate
- t₀: inflection point (tipping point)
This function describes the shift from an initial slow-growth phase to rapid acceleration (when content exceeds the threshold needed for algorithmic activation), until progressive saturation. In the literature (Rogers, Bass, Goel et al.), the tipping point typically corresponds to surpassing 16% of the potential audience: beyond this threshold, growth becomes accelerated and nonlinear.
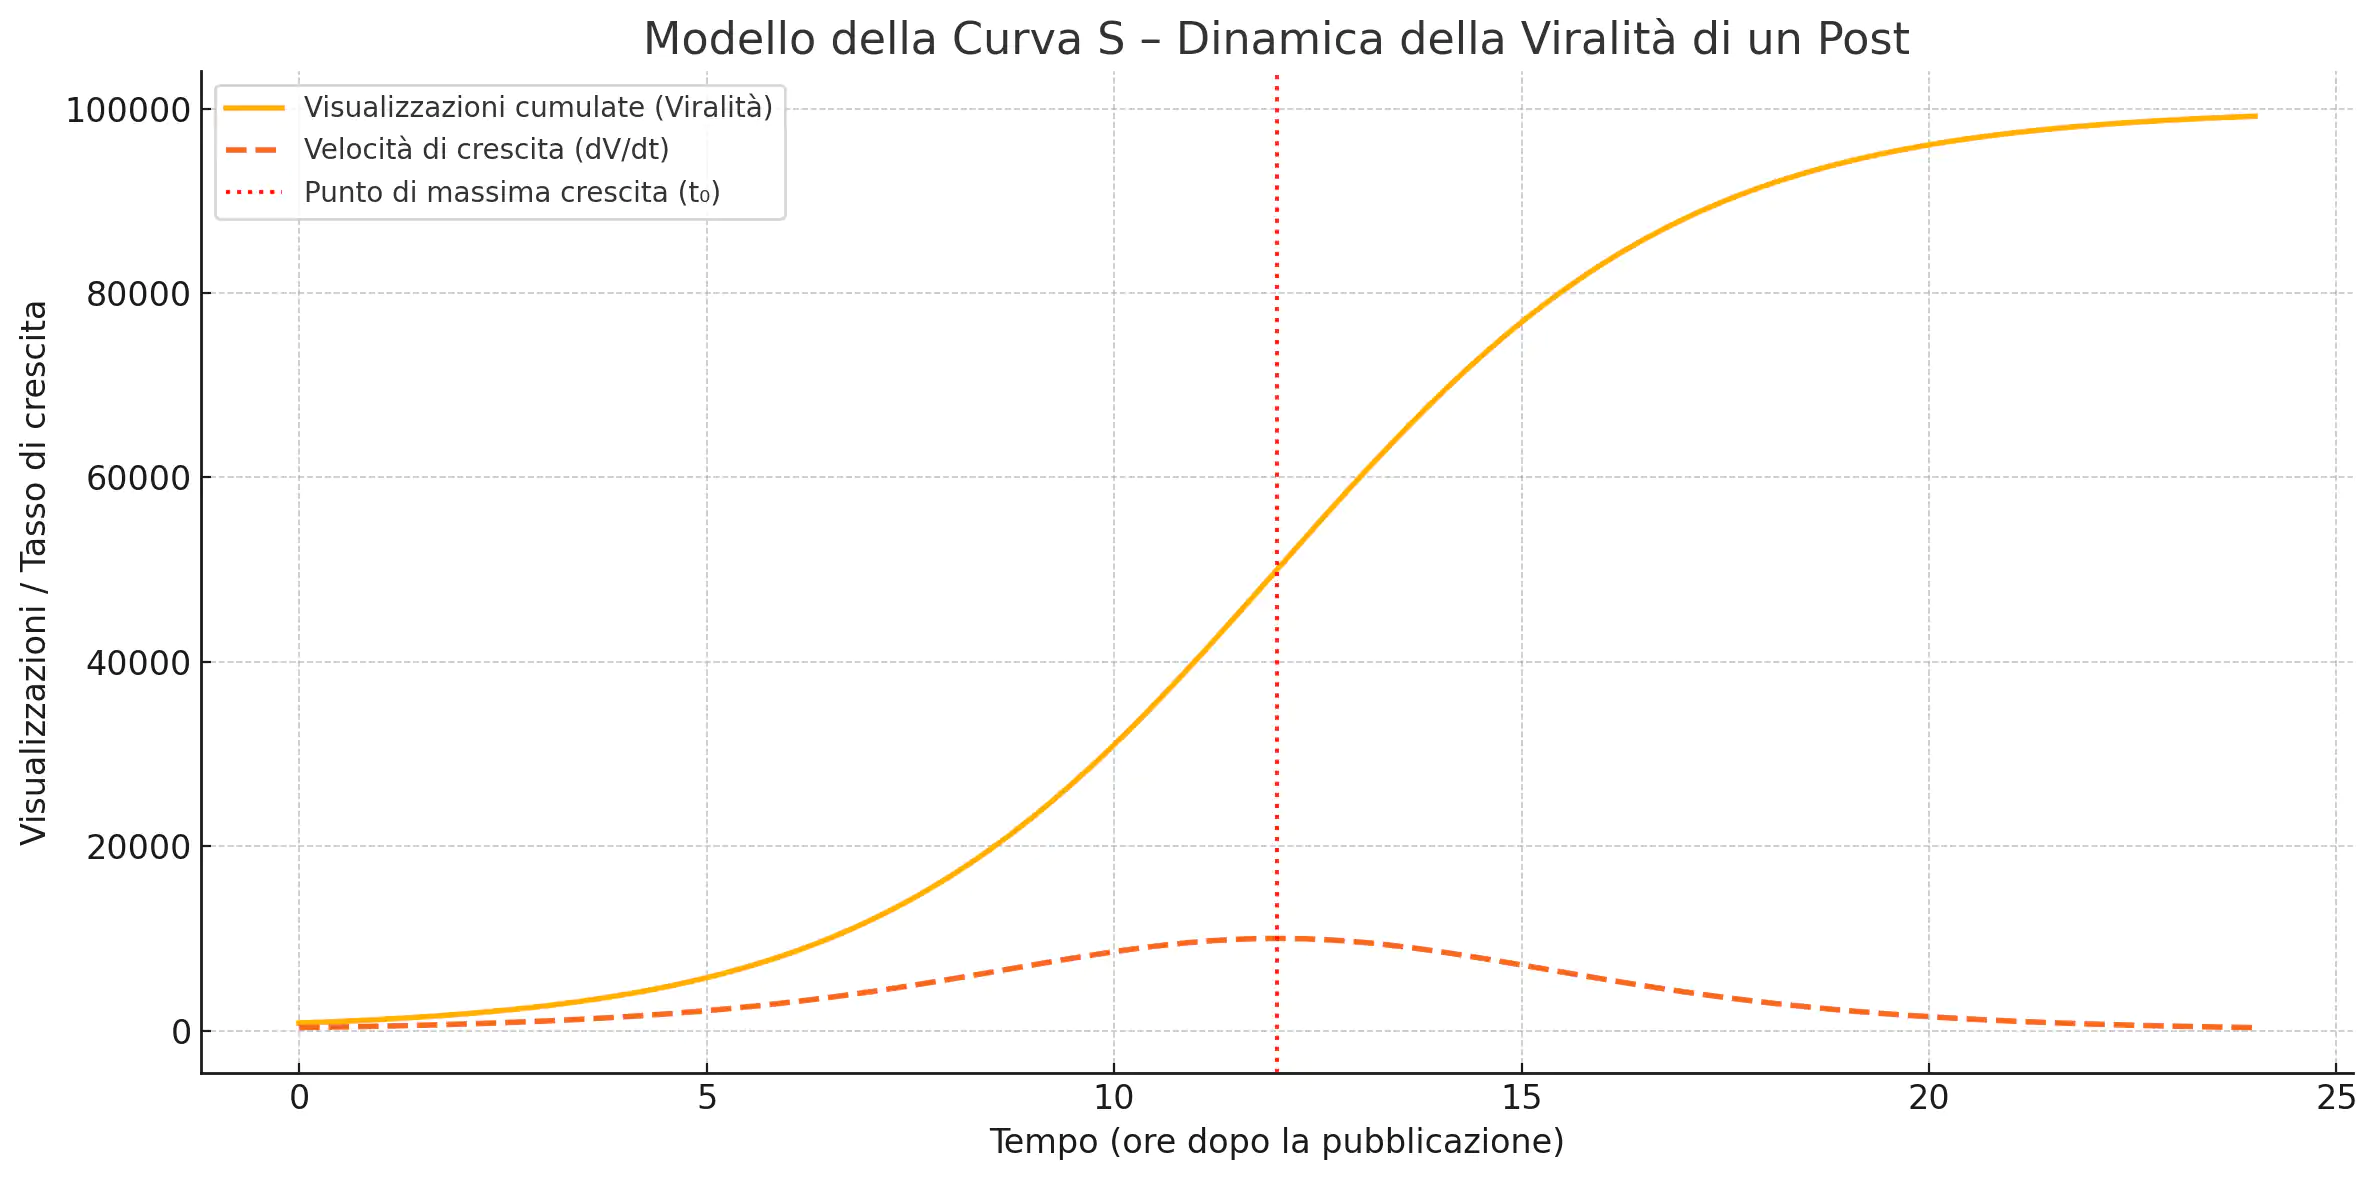
Figure 1. S-Curve Model – Viral Dynamics.
Yellow line: cumulative views; orange dashed line: instant growth rate; red dashed line: max algorithmic acceleration point.
2.2 Linear Growth vs Algorithmic Residual Effect
2.2.1 Linear Component
The linear growth phase is represented by direct organic spread:
L(t) ≈ t / τ
for very small t values. This is the growth generated by directly reached users (first-degree followers).
2.2.2 Residual Component
The residual component, calculated as:
R(t) = (1 - e−t/τ) - t/τ
represents the extra boost from the algorithm promoting content beyond the initial circle, especially via interactions.
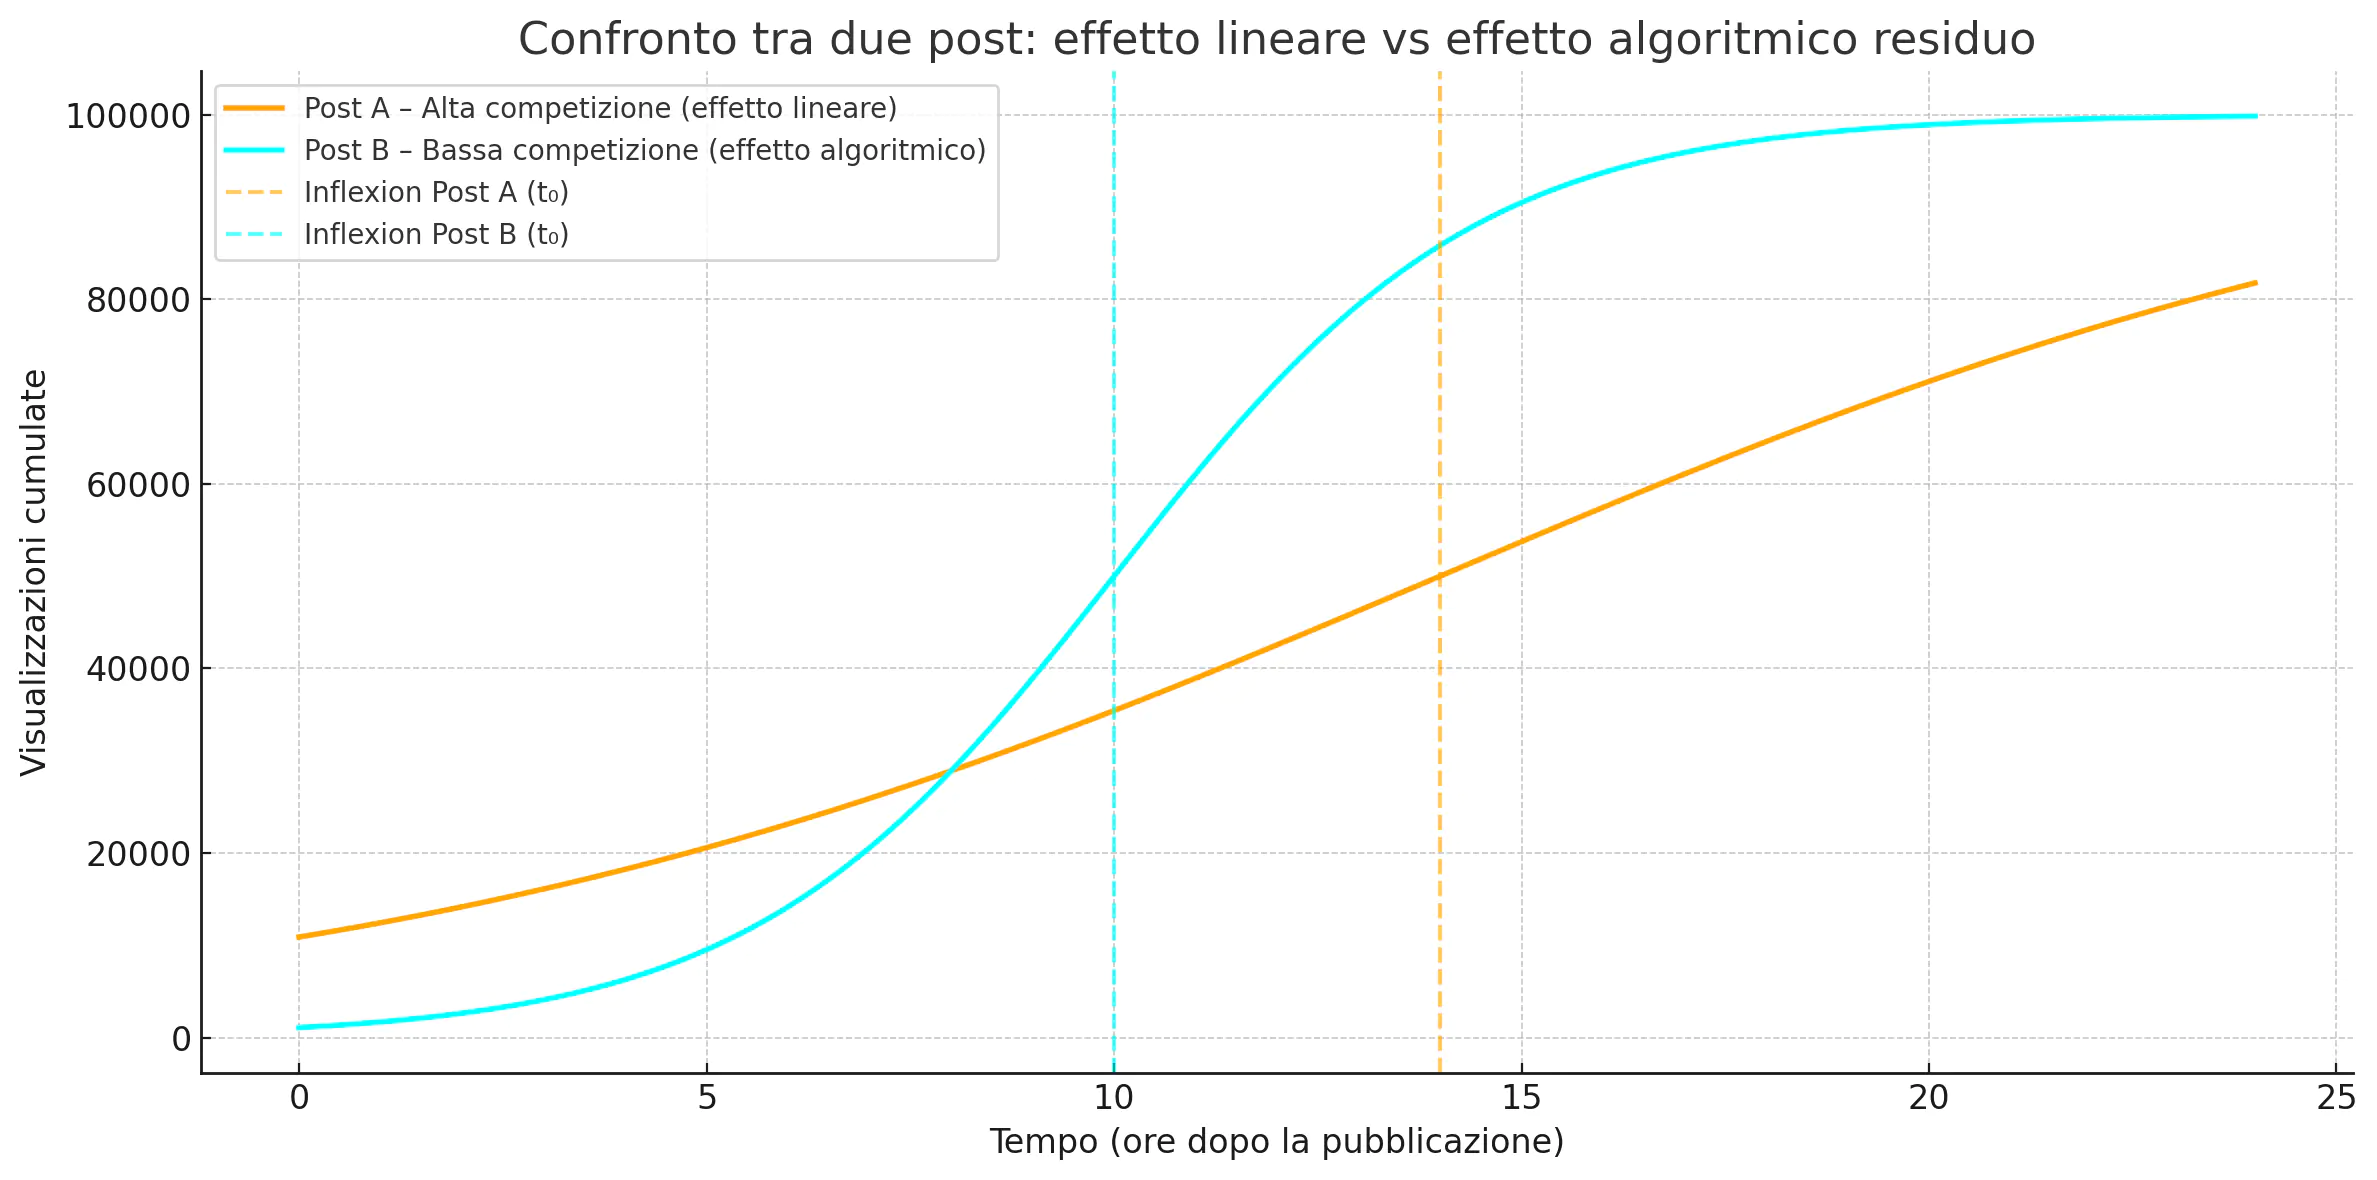
Figure 2. Actual, Linear and Residual Growth compared (Peak vs Off-peak).
Left: Peak – slow growth, delayed algorithmic boost; Right: Off-peak – early acceleration, dominant residual effect.
Interpretation:
Off-peak, the algorithm accelerates growth faster and more powerfully.
At peak time, the residual effect is initially negative, algorithmic boost arrives late, and linear growth dominates for longer.
3. Methodology & Empirical Analysis
Two typical posting scenarios were simulated:
- Post A – Peak: τ = 6h, high competition, slow initial growth, linear phase dominant, delayed algorithmic effect.
- Post B – Off-peak: τ = 2h, low competition, early acceleration, strong residual dominance, early exponential growth.
Growth dynamics in both cases are described as follows:
- Actual growth:
- fA(t) = 1 – e−t/6 (Peak)
- fB(t) = 1 – e−t/2 (Off-peak)
- Linear approximation:
- LA(t) = t/6
- LB(t) = t/2
- Residual effect:
- RA(t) = fA(t) – LA(t)
- RB(t) = fB(t) – LB(t)
Residual area: Calculated by integrating the residual function over the first 6 hours. The larger this area, the stronger the algorithmic effect.
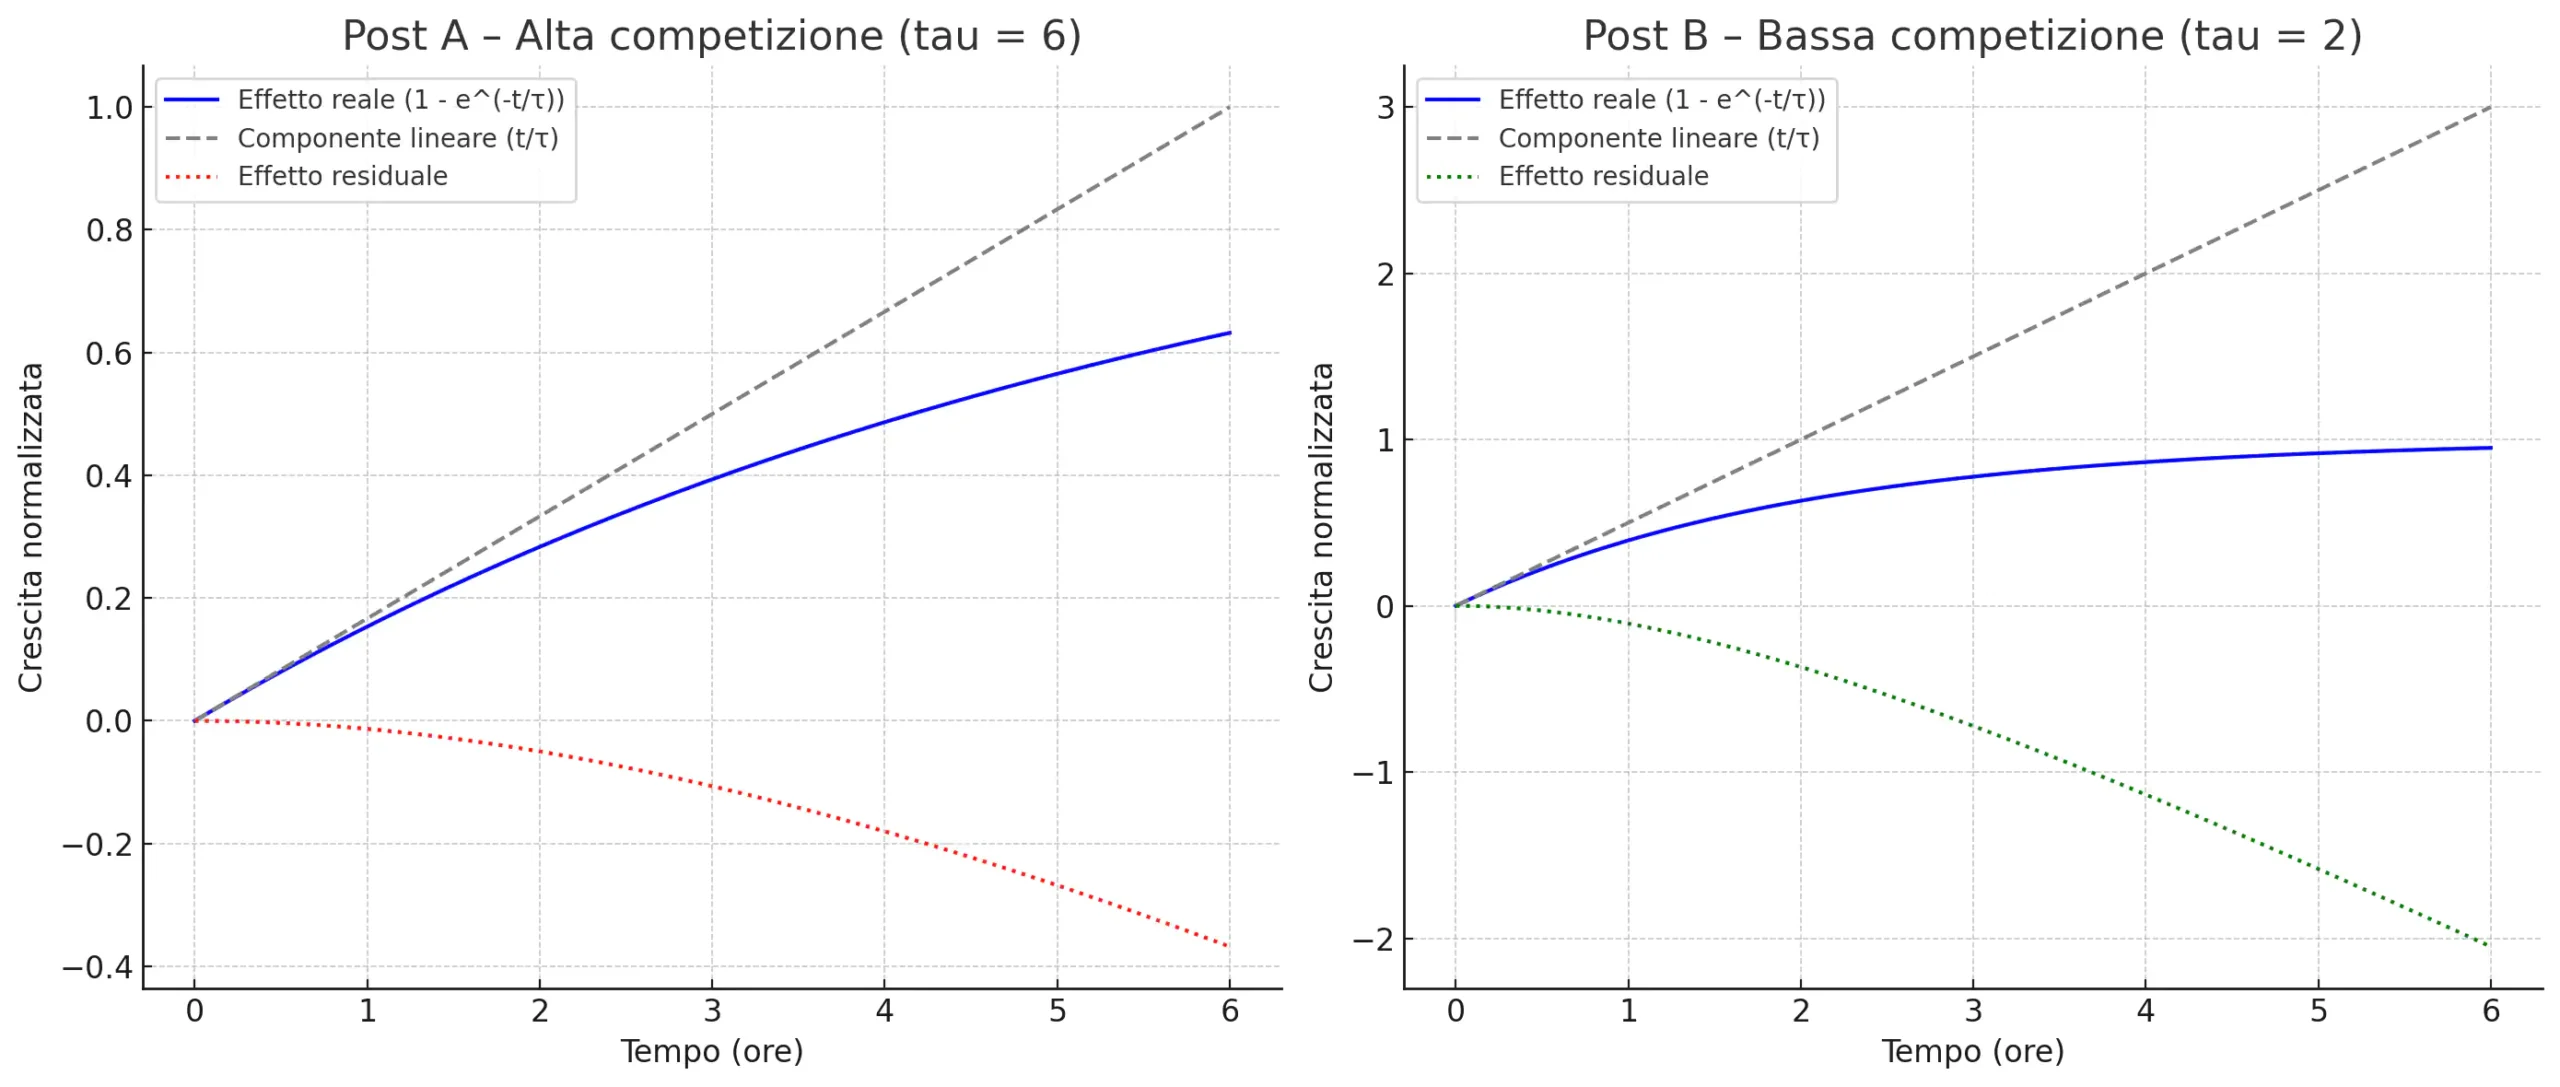
Figure 3. Algorithmic Residual Area (Peak vs Off-peak).
Left: red area = limited boost; Right: green area = much higher boost.
4.Results
| Scenario | Linear Component (%) | Residual Component (%) | Residual Area (0-6h) |
|---|---|---|---|
| Peak | 9.12% | 90.88% | -0.79 |
| Off-peak | 2.17% | 97.83% | -4.90 |
- Algorithmic activation:
- Peak: after ~4.2h
- Off-peak: after ~1.4h
- Hourly efficiency:
- Peak: ≈ 21.6%/h
- Off-peak: ≈ 69.9%/h
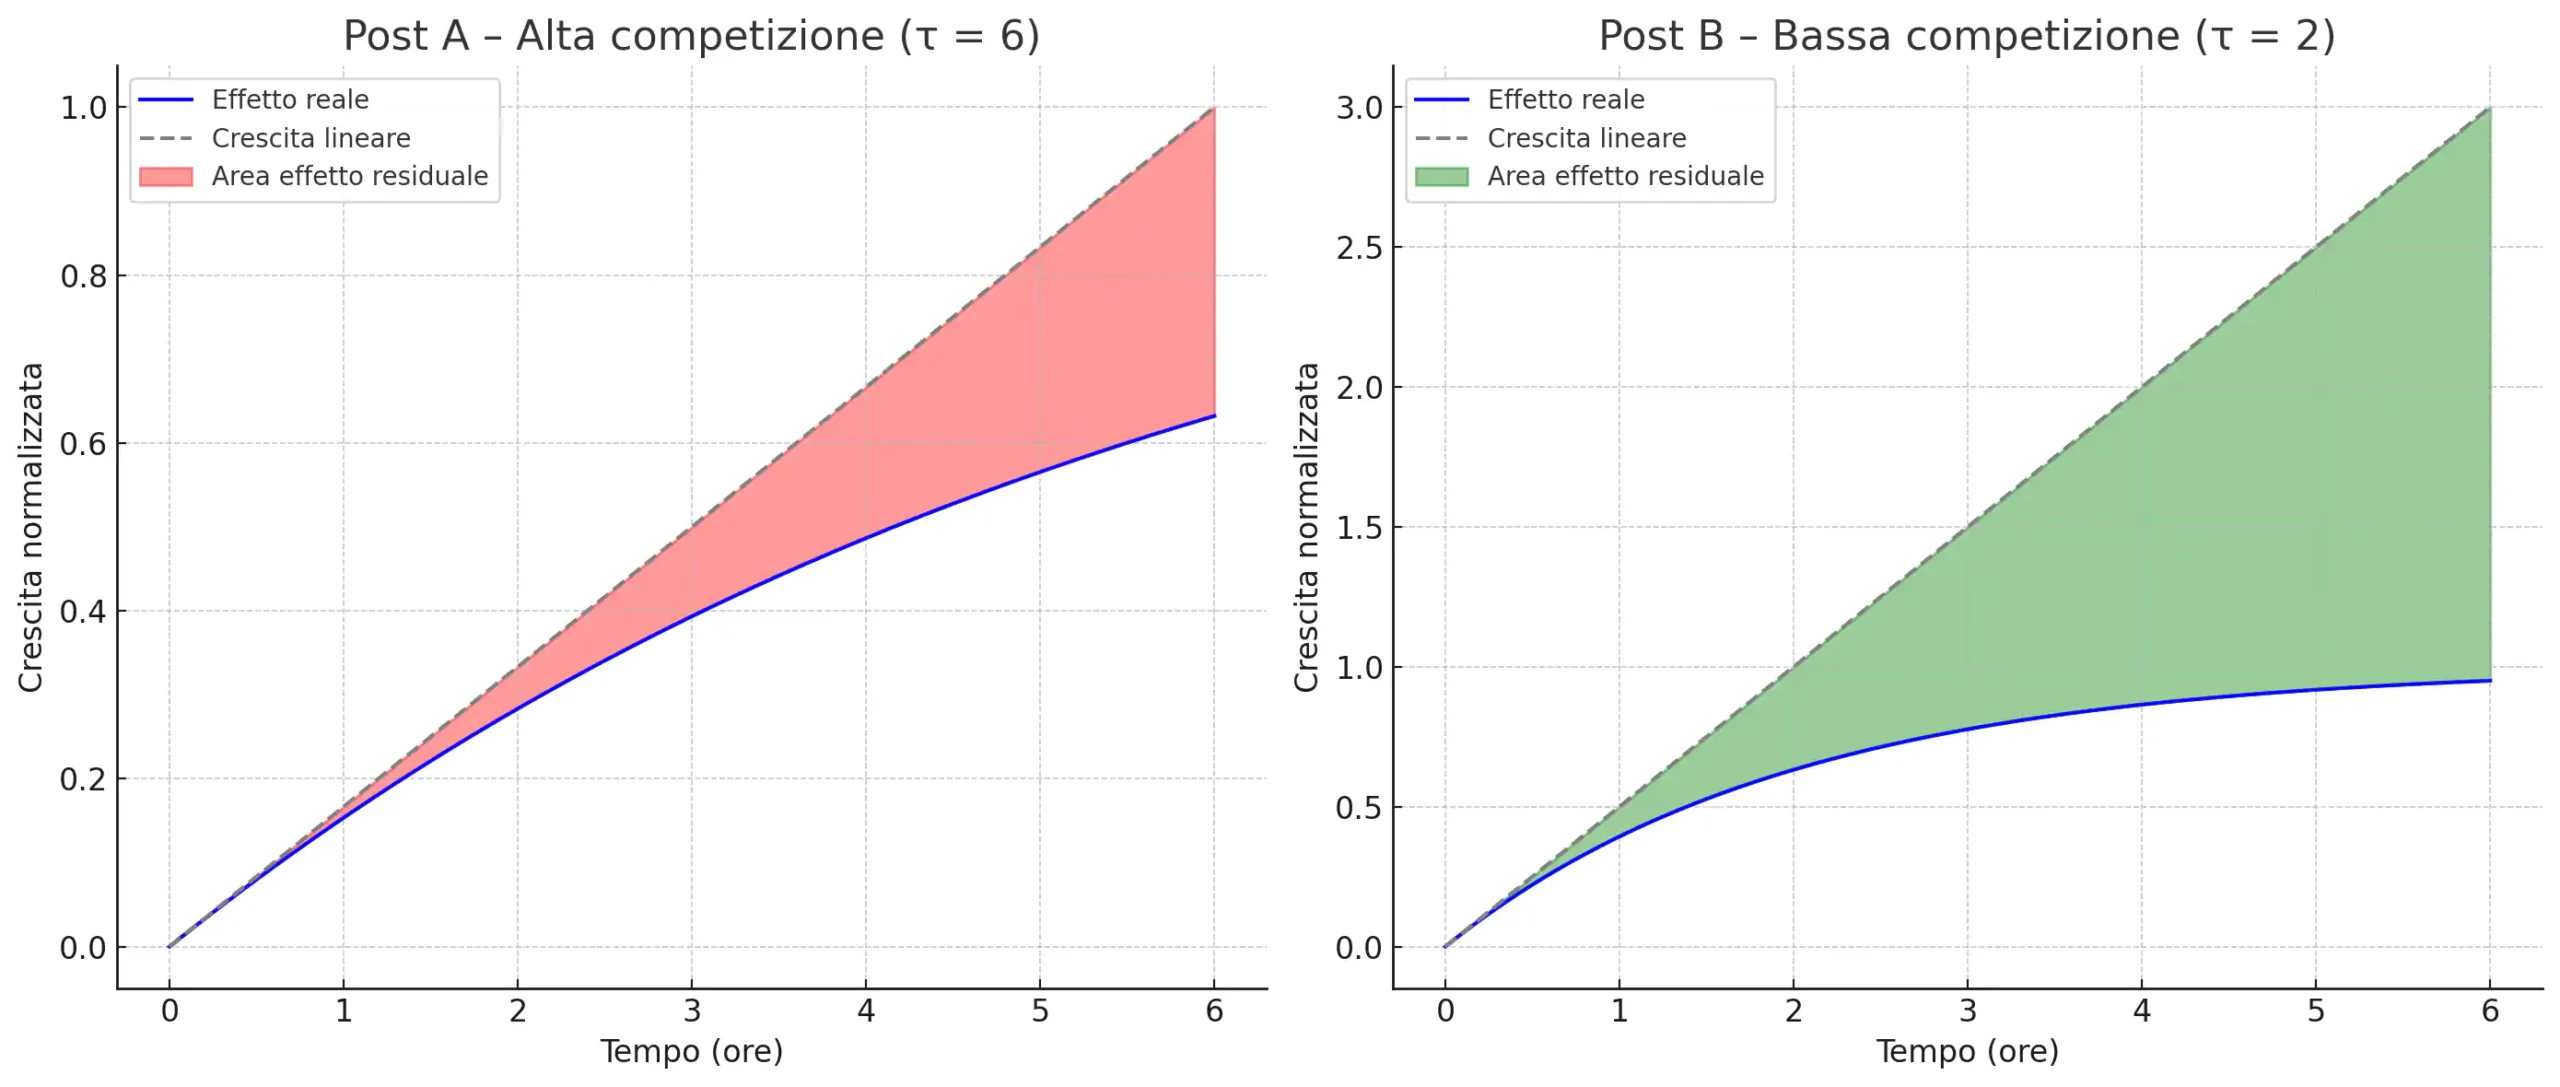
Figure 4. Algorithmic comparison: Growth Models.
Orange line: linear growth; Blue line: algorithmically amplified growth. Dashed lines: inflection point.
5.Algorithmic effetc Implications
- The tipping point coincides with the algorithmic acceleration phase (over 16% reach).
- On social media, the residual component (Bass q) dominates real virality, especially in low-competition contexts.
Operational strategies:
• Posting off-peak increases the chance of algorithmic boost and viral take-off.
• Engagement rate in the first hours (“golden hour”) is the main predictor of a post’s success.
Theoretical reflections:
Virality is not just a numbers game but the effect of an algorithmic “sensory prosthesis” that transforms both communication and social identity, amplifying emotions, interests, and conformity. The algorithm doesn’t just reward quality, it selects, standardizes and shapes collective behaviors.
6. Conclusions
Social virality is driven by the residual effect—the algorithm’s ability to amplify spread beyond initial organic growth. Posting outside peak hours and focusing on qualitative engagement during the critical activation window prove to be the most effective strategies.
In theoretical terms, algorithmic virality becomes a mirror of a new media ecology and “sensorium society”: a society where our emotions and identities are continuously remapped by the invisible filters of platforms.
Appendix: Reading the Graphs & Methodology
The graphs show the progression of theoretical curves and the difference between growth models in different scenarios. All functions and simulations use hourly time steps, with parameters (τ) chosen to reflect real dynamics on platforms like LinkedIn and Facebook.
References:
- Wiener, N. (1948). Cybernetics: Or Control and Communication in the Animal and the Machine. :contentReference[oaicite:1]{index=1}
- Rogers, E. M. (2003). Diffusion of Innovations (5th edition). :contentReference[oaicite:2]{index=2}
- Goel, S. et al. (2015). “The Structural Virality of Online Diffusion.” (Management Science)
- Bass, F. M. (1969). “A New Product Growth for Model Consumer Durables.” (Management Science) :contentReference[oaicite:3]{index=3}
- McLuhan, M. (1964). Understanding Media: The Extensions of Man. :contentReference[oaicite:4]{index=4}
- Silverstone, R. (2005). The Sociology of Mediation and Communication. (in *The Sage Handbook of Sociology*) :contentReference[oaicite:5]{index=5}